IMDB Movies Dashboard using (Python Plott)
Intro:
Wrapped up a comprehensive statistical analysis on a dataset provided by IMDB, and I'm thrilled to share the insights I've uncovered. With a top-notch credibility rating of 10/10 on Kaggle, you can trust that the findings are backed by solid analysis.
🔍 Hypotheses:
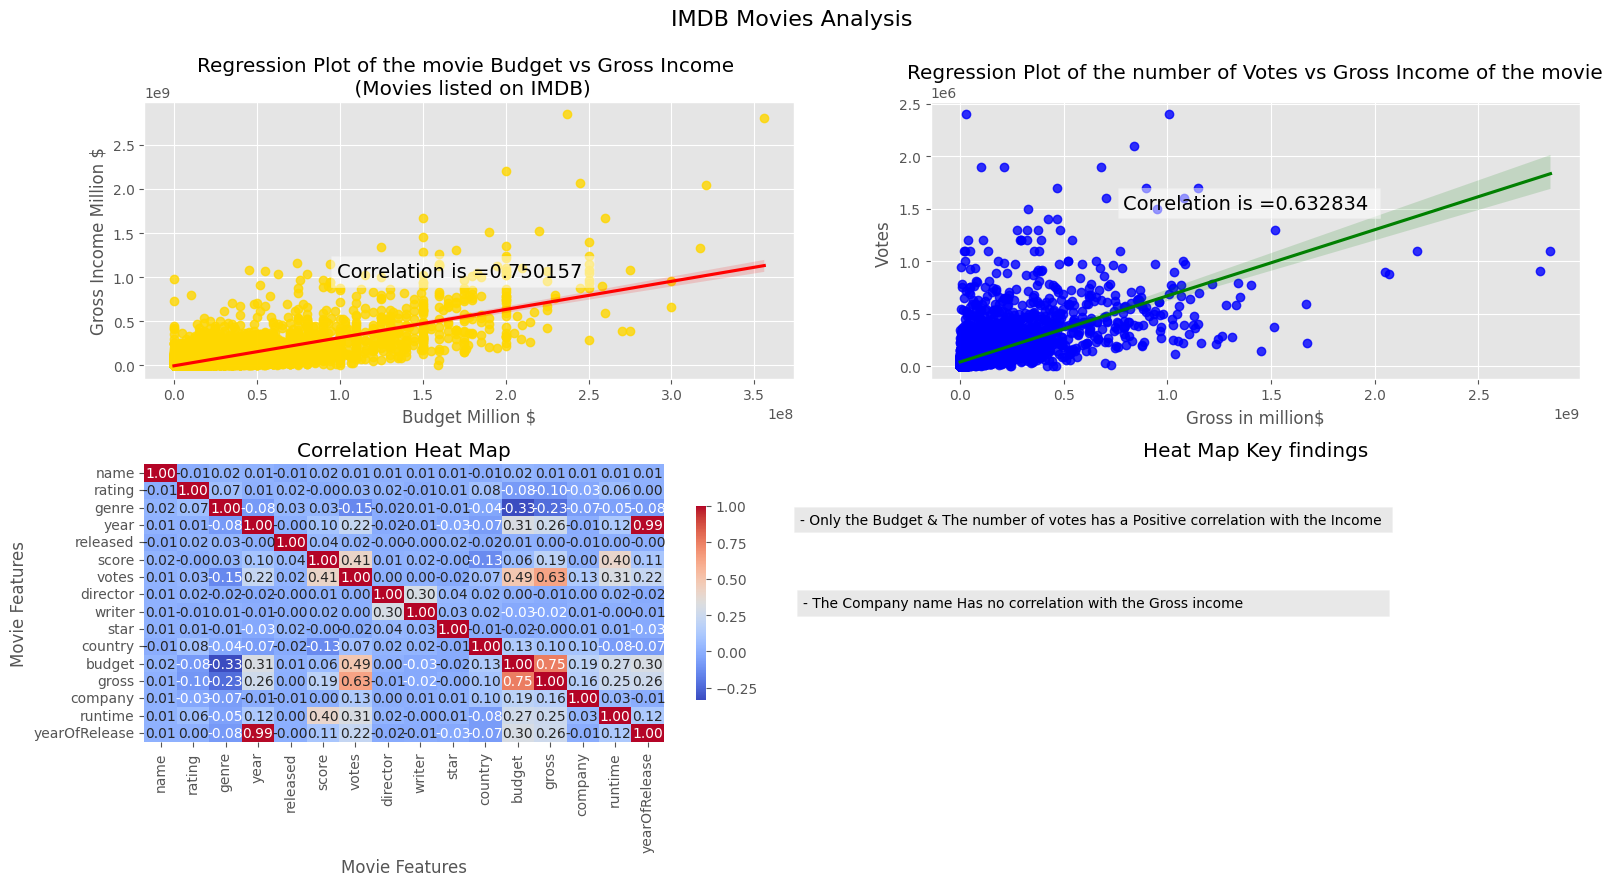
- Correlation between Budget and Gross Income: I hypothesized that the budget allocated to a movie is directly proportional to its gross income.
- Correlation between Company's Name and Gross Income: I expected to find a direct correlation between the reputation of the production company and the gross income of the movie.
📊 Process:
- Started by meticulously cleaning the dataset, including checking for and removing duplicates.
- Ensured data integrity by handling NaN values, either by removing them or replacing them with zeros in numerical columns.
- Extracted the release year from the date column, organizing it into a separate column for better analysis.
- Employed statistical methods, particularly the Pearson correlation coefficient, to quantify the relationships between various columns.
💡 Findings:
- Budget-Gross Income Correlation: My analysis confirmed the hypothesis, revealing a strong positive correlation (corr = 0.74) between the budget allocated to a movie and its gross income.
- Company's Impact on Gross Income: Contrary to expectations, I found that the production company's name had no significant effect on the gross income of a movie.
📈 Visualization:
I've transformed the insights gleaned from the analysis into an engaging and informative dashboard. Leveraging Python's powerful visualization libraries—Pandas, Seaborn, Matplotlib—I've crafted visually compelling representations of the data, providing a dynamic snapshot of the correlations and trends observed.